My previous market commentary gave shared a sentiment held by many investors of late: This Stock Market is NO FUN!
Namely the problem is that we are in a consolidation period which includes a rolling correction. The commentary to follow will spell out the reasons why…and the best way to navigate this tricky landscape.
Market Outlook
Some market commentators pointed to renewed stock weakness on Wednesday morning stemming from hotter than expected CPI inflation data. Yes, the yearly Core Inflation did not change since the last reading at 3.2%. That’s because the month over month reading increased 0.3% when 0.2% was expected.
However, the broader CPI inflation reading (which includes gas and food…which are kind of essential) that came down from 2.9% to 2.5% on the year over year view.
Bond investors were unfazed by this with the 10 year staying level at recent lows around 3.6%. However, the CME’s FedWatch analysis showed a giant shift back towards only 25 basis point cut at the Fed meeting on 9/18. Now they show 85% probability of that and only 15% chance of the larger 50 basis point cut. Note that this was nearly a dead heat just a month ago.
So if the CPI data was not the culprit for the sell off…then what was responsible?
My money rides on the Presidential Debate Tuesday night where most polls show Harris having the upper hand. This was fairly expected by most pundits. The issue is that it makes this election even tighter because in the end it really comes down to a handful of swing states.
This Presidential uncertainty leading to a sell off is nothing new for the markets. It has happened quite a few times in the past. The good news is that no matter who gets elected stocks surge higher once the election is settled.
Interestingly, the -1.61% intraday decline for stocks on Wednesday was wiped out by the end of the session as the S&P 500 (SPY) ended the day +1.06%. That means there was nearly a 3% bounce from the intraday lows. And then Thursday the market moved higher once again.
So what the heck is happening?
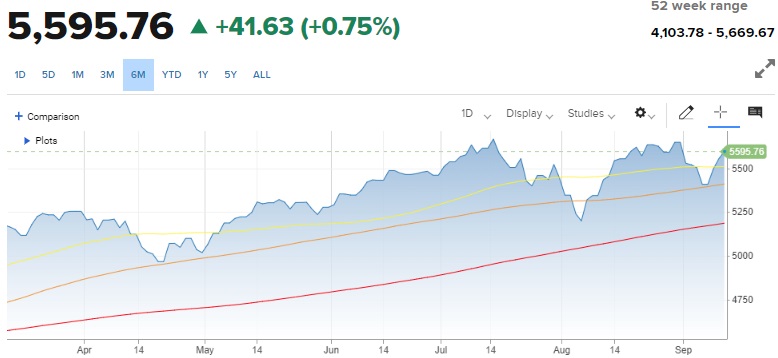
This just adds up to a classic consolidation period. That is where you are stuck under a key area of resistance and then just have volatile trading inside a range.
That area of resistance forming the top end of the range is the all time high of 5,669. And the low end is clearly the 100 day moving average (5,399)

Moving Averages: 50 Day (yellow) @ 5,508 > 100 Day (orange) @ 5,399 > 200 Day (red) @ 5,167
Some trading ranges are calm. Some are volatile and violent. This is clearly the latter.
On top of that it can take on a quality called a “rolling correction”. That is where sector rotation is so severe that each group experiences an intense period of loss equivalent to a 10% correction. But because it is just a couple sectors at a time the overall market doesn’t move much.
Then just as one groups gets their clocks cleaned…they bounce and the pain of the rolling correction rolls to some other group.
This explains the lopsided returns on a daily basis where there is a great mix of red and green arrows. Often extreme polar opposites.
As shared with you guys many times in the past…you do not chase this kind of sector rotation. That is akin to a dog chasing a car…it will never catch up.
Better to just stand still and let the waves wash over you. If you owned good stocks to begin with…then in the end they will stabilize and bounce from any weakness.
As always the key to owning good stocks is to lean into our POWR Ratings system where the computers do the heavy lifting. 118 factors in all are calculated every day for 5,300 stocks. The best of which are given an A rating which has led to a +28.56% average annual return going back to 1999.
What POWR Ratings stocks am I recommending today? Read on below for the answer…
What To Do Next?
Discover my current portfolio of 11 stocks packed to the brim with the outperforming benefits found in our exclusive POWR Ratings model. (Nearly 4X better than the S&P 500 going back to 1999).
All of these hand selected picks are all based on my 44 years of investing experience seeing bull markets…bear markets…and everything between.
And right now this portfolio is beating the stuffing out of the market.
If you are curious to learn more, and want to see my 11 timely stock recommendations, then please click the link below to get started now.
Steve Reitmeister’s Trading Plan & Top 11 Stocks >
Wishing you a world of investment success!

Steve Reitmeister…but everyone calls me Reity (pronounced “Righty”)
CEO, StockNews.com and Editor, Reitmeister Total Return
SPY shares were trading at $559.09 per share on Thursday afternoon, up $4.67 (+0.84%). Year-to-date, SPY has gained 18.37%, versus a % rise in the benchmark S&P 500 index during the same period.
About the Author: Steve Reitmeister

Steve is better known to the StockNews audience as “Reity”. Not only is he the CEO of the firm, but he also shares his 40 years of investment experience in the Reitmeister Total Return portfolio. Learn more about Reity’s background, along with links to his most recent articles and stock picks. More…
More Resources for the Stocks in this Article
Read More: Are Stocks in a Rolling Correction?
