gonin/iStock via Getty Images
The top 20: daily returns for S&P500
The SPDR S&P 500 Trust ETF (NYSEARCA:SPY) that tracks the S&P500 soared by 5.6% today (11/10/2022) – and almost broke into the top 20 daily S&P500 returns in history – since the 1920s. So, what does it mean? Is this just a bear market rally, or a signal of the major bottom. Let’s first evaluate the top 20 list of the daily rates of return for the S&P500:
|
1 |
1933-03-15 |
+16.61% |
Bottom 7/1932 |
|
2 |
1929-10-30 |
+12.53% |
Bear market rally |
|
3 |
1931-10-06 |
+12.36% |
Bear market rally |
|
4 |
1932-09-21 |
+11.81% |
Bottom 7/1932 |
|
5 |
2008-10-13 |
+11.58% |
Bear market rally |
|
6 |
2008-10-28 |
+10.79% |
Bear market rally |
|
7 |
1939-09-05 |
+9.63% |
Bear market rally |
|
8 |
1933-04-20 |
+9.52% |
Bottom 7/1932 |
|
9 |
2020-03-24 |
+9.38% |
Bottom 3/23/2020 |
|
10 |
2020-03-13 |
+9.29% |
Bear market rally |
|
11 |
1987-10-21 |
+9.10% |
Bottom |
|
12 |
1929-11-14 |
+8.95% |
Bear market rally |
|
13 |
1932-08-03 |
+8.86% |
Bottom 7/1932 |
|
14 |
1931-10-08 |
+8.59% |
Bear market rally |
|
15 |
1932-02-13 |
+8.37% |
Bear market rally |
|
16 |
1931-12-18 |
+8.29% |
Bear market rally |
|
17 |
1932-02-11 |
+8.27% |
Bear market rally |
|
18 |
1933-07-24 |
+8.14% |
Bottom 7/1932 |
|
19 |
1932-06-10 |
+7.66% |
Pre-Bottom 7/1932 |
|
20 |
1931-06-03 |
+7.54% |
Bear market rally |
As you can see from the list above,
- 12 out 20 top daily returns were the bear market rallies, and 8 out of these 12 were during the 1929-1932 bear market and the Great Depression.
- 8 out of 20 were the near-bottoms, bottoms, or after-bottoms, and 6 of these 8 were during the bottom associated with the 1932 Great Depression bottom.
- 2 out of 8 bottoms were associated with the bottoms of the sharp corrections, the 1987 and the 2020 bottom. The 1987 correction was not associated with a recession, and it is generally considered as a technical in nature. The 2020 bottom was associated with the extraordinary events related to covid19 and the monetary and fiscal covid stimuli.
Based on the historical evidence, the 5.6% daily spike in S&P500 (SPX) is either a signal of a major bottom or just another bear market rally.
The major bottom thesis
The major bottom thesis requires an actual bear market capitulation, such as the 1932 bottom, the 2003 bottom or 2009 bottom. In each of these cases, there was a clear policy response to stimulate the economy, both monetary and fiscal.
The 11/10/22 daily spike was in response to the positive surprise in the CPI inflation, which raised the hope of the Fed pivot – or a less aggressive monetary policy tightening.
As I previously explained, the full bear market has 3 stages: 1) the liquidity selloff in response to the Fed’s monetary policy tightening, 2) the recessionary selloff caused by the Fed’s tightening, and 3) the credit crunch (or a financial crisis) triggered by the deep recession.
The bullish case assumes that the current bear market ended with the Phase 1 – or with the peak Fed hawkishness. It’s true, we are likely past the peak inflation, and thus the peak hawkishness.
However, the question is whether there is a Phase 2 coming – or a recessionary selloff, and whether “something will break” during the process and cause the Phase 3 and the credit crunch.
The recessionary selloff
The S&P500 PE ratio after the 11/10 spike is 20.58. The market is still overvalued and not priced for a recession.
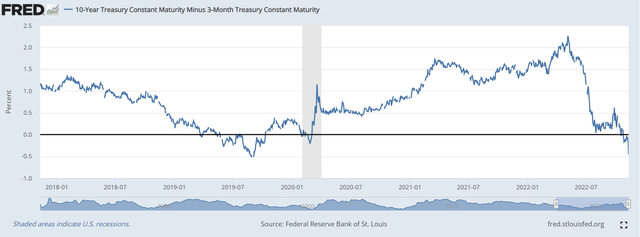
Is the recession coming? The spread between the 10Y Treasury Bond yield and the 3-Month Treasury Bill yield is the most reliable and the Fed-favored recession indicator, and once it inverts, the recession becomes almost a certainty.
Currently, the 10y-3mo spread is deeply inverted at -0.46%. Here is the chart:

FRED
Based on yield curve spread indicator, the recession is coming, and the market is not priced for it – based on the PE ratio of over 20. Thus, the current bear market has not bottomed yet, and the next Phase of the bear market is coming.
Why is the 10Y-3mo curve inverted? Why is this signaling a recession?
The 10Y-3mo spread is inverted because the Fed is hiking the short-term interest rates above the long-term interest rates. Why? To cause a recession to bring the inflation down.
The market hopes that the Fed will slow down with the interest rates hikes, because the inflation has peaked. Too late. The damage has been done. The Fed could even stop after the December 50bpt hike, the 10y-3mo spread has already inverted.
But don’t count on the Fed to pause yet. If the core CPI printed today 4.3% (instead of actual 6.3%), and that was expected to persist, the Fed would still have to further hike. The target is 2% inflation.
But don’t expect inflation to sharply fall either – without a deep recession. The economic war with China is still active, and it’s more likely to escalate. This is inflationary. The war in Ukraine is still active and it’s more likely to escalate. This is also inflationary. The unemployment rate in the US is still near record lows, and this is inflationary. The only thing the Fed can influence is the US unemployment rate – by inducing a recession.
It’s a bear market rally
We are not at a major bottom; we are possibly in-between the Phase 1 selloff and a Phase 2 recessionary selloff. There are already signs of “things breaking” like the cryptocurrencies, which could lead to the Phase 3 selloff.
Bear market rallies happen during the “in-between periods”, so this bear market rally could continue. The bottom will be in-place when the Fed wants to the bottom to be in place – this will be the pivot the bulls are waiting: the Fed slashing interest rates and resuming QE. I don’t think anybody expects this over the near term. Don’t fight the Fed. The bear market rally is the opportunity to sell or re-short.
SPY sector analysis
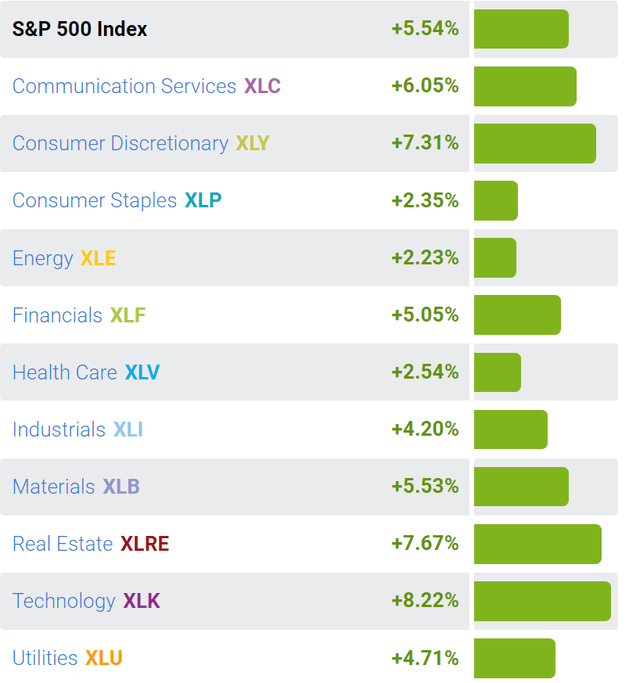
All SPY sectors were up significantly on 11/10/2022, led by the beaten down technology sector (XLK), the interest rate sensitive real estate sector (XLRE) and the cyclical discretionary sector (XLY). These sectors should not lead pre-recession, while the Fed is trying to cool off economy.

SelectSectorSPDR
Read More: SPDR S&P 500 Trust ETF: Bear Market Rally Or A Major Bottom?
