Rawpixel/iStock via Getty Images
After a correction in September, the SPDR S&P 500 Trust ETF (SPY) has broken out above its previous resistance line in a very clear way. Is it a fake move or is it supported by something real? This post doesn’t make predictions. It tries to shed some light on what is behind this move by digging into economic, fundamental and sentiment data.
Chart: FinViz
Economy
Unemployment
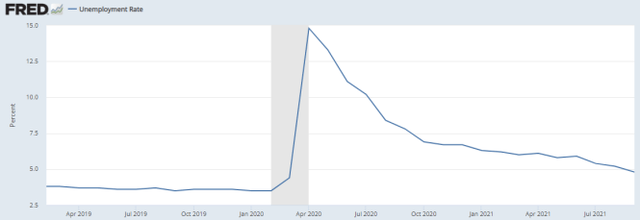
Looking at unemployment rate for 70 years, I found its short-term trend may be one of the best market timing indicators among simple economic data. The last release of unemployment rate is at a 17-month low. It looks good for now.
U.S. Bureau of Labor Statistics, Civilian Unemployment Rate [UNRATE], retrieved from FRED, Federal Reserve Bank of St. Louis.
Housing Starts
New housing units starts are close to their value 11 months ago and the trend is slightly bearish for six months.
U.S. Census Bureau and U.S. Department of Housing and Urban Development, Housing Starts: Total: New Privately Owned Housing Units Started [HOUST], retrieved from FRED, Federal Reserve Bank of St. Louis.
Retail and Food Sales
Retail and food sales reached an all-time high in April and have been on a plateau for six months.
Federal Reserve Bank of St. Louis, Advance Real Retail and Food Services Sales [RRSFS], retrieved from FRED, Federal Reserve Bank of St. Louis.
Treasury yield spread
The 10-year minus 3-month Treasury yield spread was negative on 3/22/2019 for the 1st time since 2007. A negative value has anticipated previous recessions by 6 to 18 months.
Spread T10Y3M retrieved from FRED, Federal Reserve Bank of St. Louis. Grey zones are recession periods.
Coming back in positive territory doesn’t invalidate the signal: the spread was positive again when recessions started. In this case, more than 30 months have passed since the signal, and we had a short recession related to the pandemic. We could wonder if it counts. What else could I say about this indicator? I don’t like it. It looks a possible recession predictor, but a bad timer. Anyway, the sample of past signals is too small to evaluate its statistical accuracy.
Fundamentals
Valuation
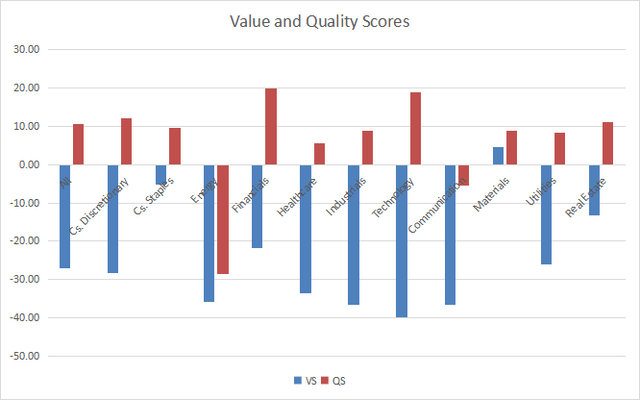
S&P 500 stocks are overpriced by about 27% according to my metrics. It’s bad, but I have already measured an overvaluation of 39% before the correction of February 2018. Moreover, in all sectors except energy and communication, quality scores are above a baseline calculated with 11-year averages (see next chart).
Value scores (“VS”) and quality scores (“QS”) for all GICS sectors in the S&P 500 index. Metrics are defined in my monthly dashboard articles. Chart: author
Despite high valuations, the equity risk premium is favorable to stocks regarding my SEP metric (simplified equity premium). It means stocks look better than bonds. I have recently written an article on the current bear market in bonds.
EPS trend
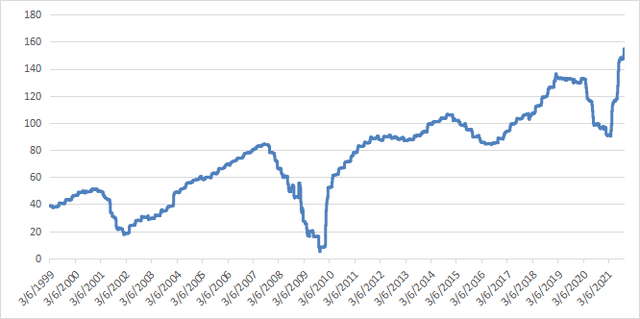
The S&P 500 aggregate EPS has hit an all-time high in the last earnings season.
S&P 500 aggregate EPS, trailing twelve months. Chart: author; Data: Portfolio123
Earnings Surprises
The next chart plots the difference between good and bad EPS surprises in S&P 500 companies since 2002 in percentage (0.5 is 50%). In the last earnings season, 86.2% of S&P 500 companies has beaten EPS expectations and 10.6% missed them. This is a new high for the difference “good minus bad” in S&P 500 earnings surprises.
Chart: Portfolio123
Sentiment
Individual Investors
In last week’s AAII survey, bullish opinions are 8.9 percentage points above the historical average (this is about one standard deviation) and 10 percentage points below the 12-month high reached in April. It means the crowd’s sentiment is bullish, but not in euphoria. On 15th September, the bull ratio fell below one standard deviation under the mean and it did it again two weeks later. According to AAII historical data, it was a contrarian clue pointing to an 80% probability of gain in 6 months with a median return about 6%. Of course, past data are not a guarantee for the future.
Short seller sentiment
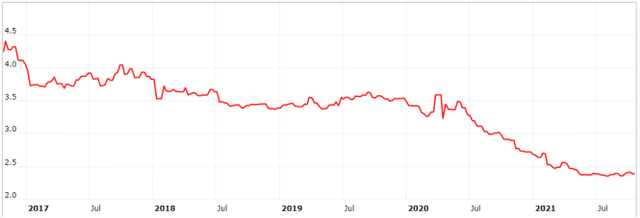
Academic research shows that the average short interest in stocks is a good predictor of market return: the lower the value, the better the expectations (Rapach, Ringgenberg, Zhou, 2016). The average short interest in S&P 500 stocks fell to a 20-year low in July and is 4 bps above it as of writing.
5-year chart of the average short interest in S&P 500 stocks, in percentage points. By Portfolio123
Takeaway
The S&P 500 just went through a seasonal correction in line with September’s bad reputation. Economic indicators have recovered very fast since April 2020, but their signals are mixed now: housing starts are declining and retail sales are on a plateau. S&P 500 stocks are overpriced by historical standard, but the equity risk premium is favorable to stocks. Moreover, aggregate earnings and EPS surprises support SPY moving to a new high. Some sentiment data have sent bullish signals and seasonality is supportive for the next two months. Of course, there is no guarantee and anything may happen.
Read More: SPDR S&P 500 Trust ETF (SPY): The Data Behind A New High


