

TriggerPhoto/iStock Unreleased via Getty Images
I recently looked at the market-implied outlook for QQQ, a probabilistic forecast that represents the consensus opinion of buyers and sellers of options. I have been running the market-implied outlook on QQQ and SPDR S&P 500 Trust ETF (NYSEARCA:SPY) for several years now. Prior to my post on November 10th, I had written about the market-implied outlook for QQQ on September 28th. I was prompted to write my recent update because the market-implied outlook for QQQ had changed substantially since late September. On September 28th, the market-implied outlook for QQQ to early 2022 was robustly bullish. By early November, the market-implied outlook had shifted to mildly bullish, but the change was sufficiently abrupt that I changed my overall rating on QQQ from bullish to neutral.
In this post, I have updated the market-implied outlook for the S&P 500 (SPY) to mid-January 2022 and to mid-March. My most-recent post on SPY was on September 4th.
Background on the Market-Implied Outlook
The price of an option on an index ETF, SPY in this case, represents that market’s consensus estimate for the probability that the price of the ETF will rise above (call option) or fall below (put option) a specific level (the strike price) between now and when the option expires. By analyzing the prices of call and put options at a range of strike prices, all at the same expiration date, it is possible to calculate a probabilistic forecast for price returns from now until the option expiration date. This probabilistic forecast is referred to as the market-implied outlook. The key early work on this problem was performed by Mark Rubinstein and Jens Carsten Jackwerth in the mid ’90s.
In 2018, I built my own implementation for market-implied outlooks, and I have been running outlooks for SPY, QQQ, and individual stocks since then. My earliest article on Seeking Alpha on market-implied outlooks for SPY and QQQ was on September 9, 2018.
The prototypical form of the market-implied outlook for an equity index has a well-defined peak in probability at a positive price return, and substantial negative skewness, reflected in an asymmetrical large negative tail. The negative skewness means that there is a higher probability of large negative returns than for large positive returns. The stock market provides investors with a high probability of making money, in return for bearing the risk of large losses.

Market-implied price return probabilities for SPY for the 4.3-month period from September 12, 2021, to January 21, 2022 (Source: Considine/Seeking Alpha)
This all makes sense in theory. What has been somewhat surprising to me over the past three years is how well-behaved the market-implied outlooks for equity indexes are. The prices of options indicate a level of order in the market that I had not anticipated.
On January 11, 2021, I wrote a post on Seeking Alpha in which I generated the market-implied outlook for SPY January 21, 2022 (using options that expired on that date). For the (almost) 12-month period, the peak probability corresponded to a price return of 9.5%, and the volatility was 22.8%. To make comparison of the relative probabilities of positive and negative returns easier, I often chart the market-implied outlook with the negative return side of the distribution rotated about the vertical axis (as in the chart below from my January post).
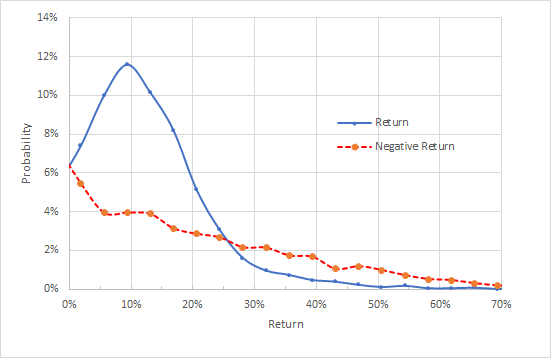
Option-implied probabilities for SPY price return price return for the period from Jan 11, 2021-Jan 21, 2022. The negative return side of the distribution has been rotated about the vertical axis (Source: Considine/Seeking Alpha)
As a measure of the risk-return balance for an equity or equity index, I look at the ratio of the peak-probability return and the standard deviation of the distribution. In this case, adding dividends, the ratio is 0.48 (9.5% peak probability price return + 1.5% dividend, divided by 22.8% volatility). The higher this ratio is, the more attractive the investment.
When I generated the market-implied outlook for SPY in mid-September, the peak probability corresponded to a price return of 5% for the 4.3-month period to January 21, 2022, and the volatility for that period was 11.85% (19.7% annualized). The dividends anticipated for the 4.3-month period added another 0.6%, for a peak probability total return of 5.6%. The ratio of this return to the volatility is 0.47.
Updated Market-Implied Outlook for SPY
I have run the market-implied outlook for SPY for the next 2.3 months (using options that expire on January 21, 2022) and for the next 4.2 months (using options that expire on March 18, 2022).

Market-implied price return probabilities for the 2.3-month period from now until January 21, 2022 (Source: Author’s calculations using options quotes from ETrade)
The market-implied outlook for this period is consistent with the expected form, with a well-defined peak probability (at price return of 2.5%) and negative skewness. The volatility calculated from this distribution is 8%. We expect a single dividend payment for SPY between now and January 21, 2022, which would add about 0.3% in additional return. The ratio of peak-probability total return to volatility is, therefore, 0.35 (2.8%/8%).
Viewing this market-implied outlook with the negative return side of the distribution rotated about the vertical axis (see chart below) makes a long position in SPY look like a good bet, even though the ratio of peak-probability return to volatility is markedly lower than we have been seeing as recently as September.
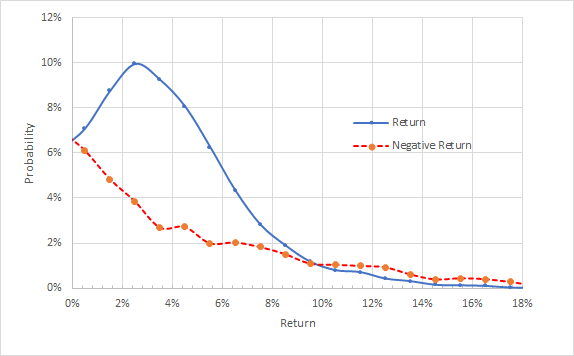
Market-implied price return probabilities for the 2.4-month period from now until January 21, 2022. The negative return side of the distribution has been rotated about the vertical axis (Source: Author’s calculations using options quotes from ETrade)
The market-implied outlook for the 4.2-month period from now until March 18, 2022 (calculating using options that expire on that date) is consistent with the shorter-term outlook.

Market-implied price return probabilities for the 4.2-month period from now until March 18, 2022 (Source: Author’s calculations using options quotes from ETrade)
There is a well-defined peak probability that corresponds to a price return of 4% for the 4.2-month period. The volatility of the distribution is 11.6%, which annualized to 19.6%. We anticipate 0.6% in dividend yield over the 4.2-month period, for a peak-probability total return of 4.6% although the second dividend payment ex date may come just after March 18th. The ratio of this total return to the period volatility is 0.4.
Summary
The market-implied outlook for SPY to January 21, 2022, remains bullish, but the peak-probability total return for this period is relatively low as compared to the expected volatility. Things start to look better by mid March, but the outlook is less bullish than it was earlier in 2021 and as recently as September. I am maintaining my bullish rating on SPY, but I am feeling more cautious than I was earlier in the year.
Read More: SPY: Market-Implied Outlook For S&P 500 To Early 2022 (NYSEARCA:SPY)